Review school performance from the data your team already records
This guide shows how Intelligence Cloud turns scheduling, attendance, invoices, payments, student balances, discounts, and teacher payouts into management reports for language schools, tutoring centers, and other lesson-based education businesses.
Reports are generated from operational history, not rebuilt in spreadsheets
School management reports should answer practical questions: which students still have unpaid balances, why received revenue is lower than expected, which groups drive margin, and how teacher payouts affect the result. Reports are generated from schedules, attendance, invoices, payments, discounts, student balances, and teacher payout records instead of being rebuilt in spreadsheets.
Why is May revenue lower than expected?
The dashboard shows 660 EUR received this month while expected revenue is 6998 EUR. The revenue report explains the gap: May accrued revenue is 7037 EUR, received payments are 660 EUR, discounts are 217 EUR, teacher payouts are 1490 EUR, and the net result is -830 EUR.
When to use this workflow
Use this workflow when a manager needs to close a month, explain a revenue gap, compare groups, or check payout impact without exporting separate spreadsheets from each module.
Example workflow from dashboard signals to report details
The example follows May 2026. The management dashboard shows received payments, expected revenue, debtors, attendance risks, and teacher payouts. Revenue and group reports explain where the gap comes from.
Start from the management overview
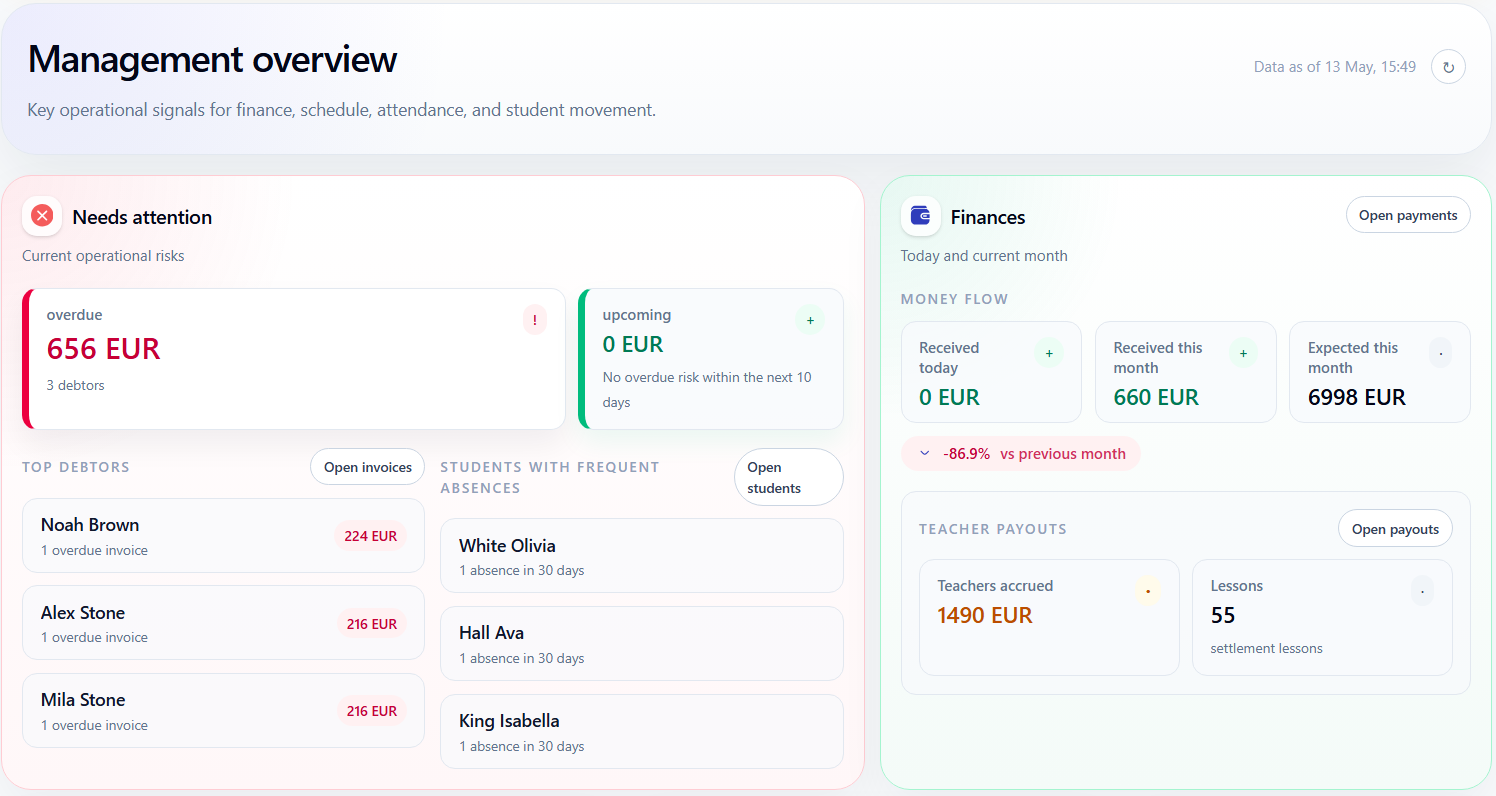
The management overview gives the owner a first read of the month. In this example, the dashboard shows only 660 EUR received this month against 6998 EUR expected revenue. Teacher payouts are 1490 EUR, and the dashboard also shows overdue balances, top debtors, and frequent absences.
- Received this month: 660 EUR
- Expected this month: 6998 EUR
- Teacher payouts: 1490 EUR across 55 lessons
Open revenue overview to explain the gap
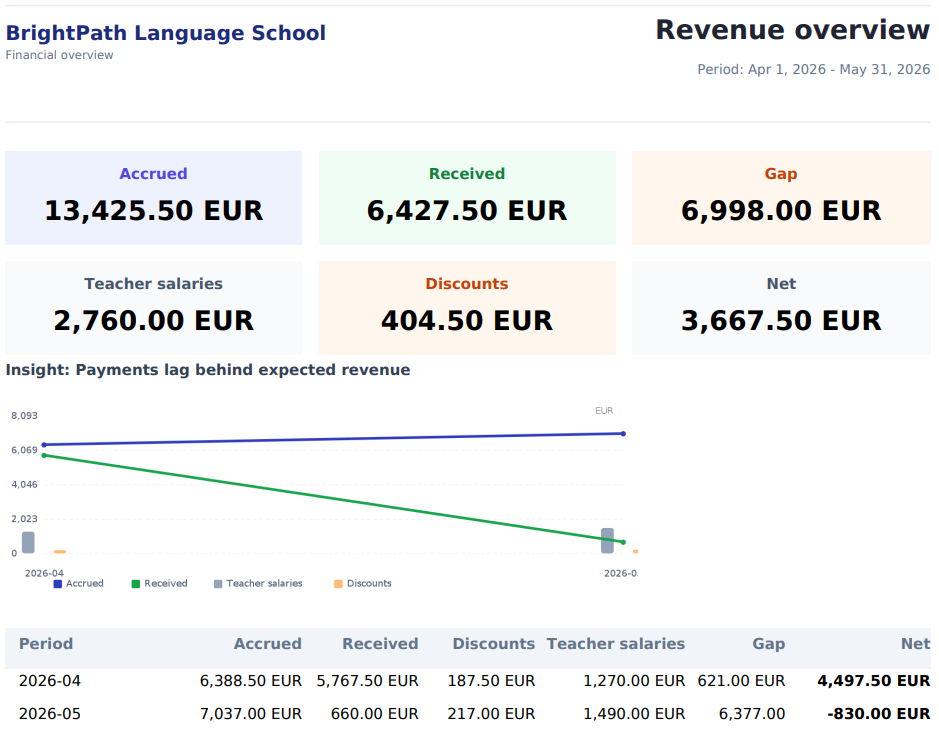
The revenue overview separates invoiced or accrued amounts from received payments, discounts, outstanding balances, payout costs, and net result. For May 2026, the report shows 7037 EUR accrued, 660 EUR received, 217 EUR discounts, 1490 EUR teacher payouts, and a 6377 EUR payment gap.
- Accrued revenue shows what invoices generated.
- Received payments show what actually came in.
- The gap shows what still needs attention before the month can be trusted.
May accrued = 7037 EUR
May received = 660 EUR
May payment gap = 7037 - 660 = 6377 EUR
May net result = received - teacher payouts = 660 - 1490 = -830 EUR
Compare which groups drive revenue and margin
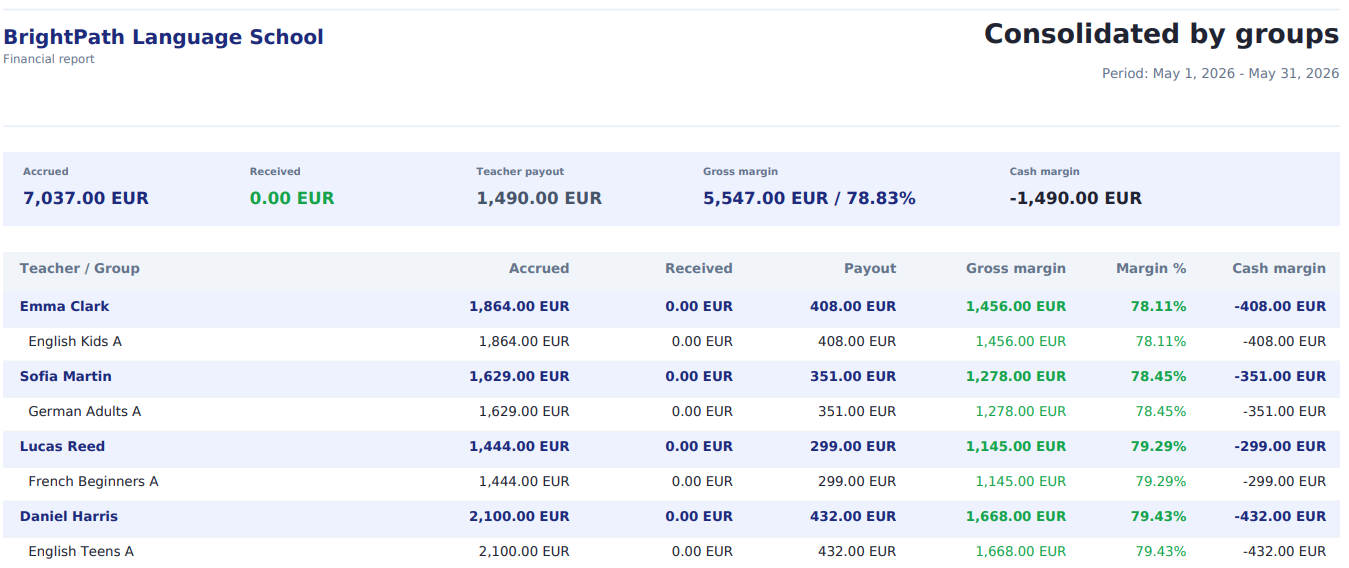
The group profitability report breaks the same month down by teacher, group, revenue, teacher payout cost, gross margin, and cash margin. Here, group margin means revenue minus teacher payout cost before overhead and other school expenses. This helps a school owner see which classes are healthy by contribution margin and which groups still need payment collection.
- Gross margin compares accrued student charges with teacher payout cost.
- Cash margin shows the result based on received payments.
- Rows stay connected to the same lesson, invoice, payment, and payout history.
Reports should explain decisions, not just export numbers
A useful school report connects operational facts to management questions. This is operational reporting: reports are built from daily school records rather than manually prepared spreadsheets. The owner should be able to see whether a revenue gap comes from unpaid invoices, fewer completed lessons, discounts, attendance issues, or payout cost.
Why did May receive only 660 EUR against 6998 EUR expected? Check invoices, payments, discounts, overdue balances, group margins, attendance risks, and payout totals from the same workflow.
Check payout details when margin needs context
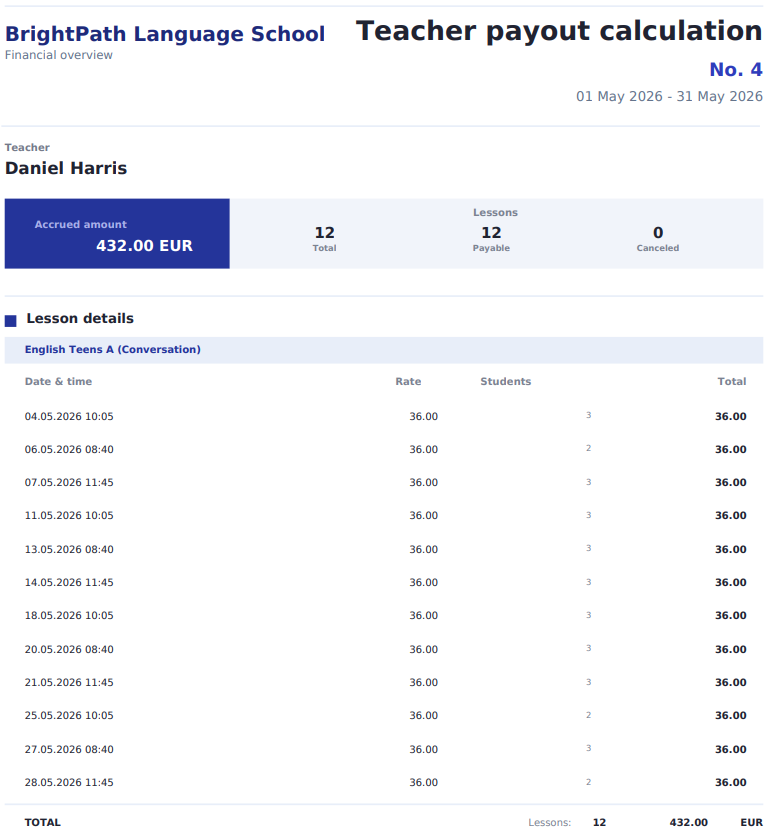
Teacher payout cost in management reports should not be a manual number. When a payout total affects margin, the payout statement can explain the underlying lesson rows, teacher rate, student count, and final amount.
- Payout totals come from completed lesson records.
- The statement keeps lesson rows and rates visible.
- Reports and payout statements use the same operational facts.
Report logic notes
These notes explain how management reports connect revenue, payments, group profitability, attendance risks, and teacher payouts.
Revenue reports should separate accrued and received amounts
Accrued or invoiced amounts and received payments answer different questions. Accrued revenue shows what the school charged through invoices. Received payments show what actually arrived. Discounts, outstanding balances, and payout costs should stay visible separately, so the gap becomes a collection and operations question instead of a spreadsheet mystery.
- Accrued revenue comes from invoice rows.
- Received revenue comes from recorded payments and allocations.
- The gap helps identify unpaid balances before the month is closed.
Group profitability depends on both billing and payout data
A group can look strong by accrued revenue but weak by cash margin if payments have not arrived. Comparing group revenue with teacher payout cost helps owners understand contribution margin for classes before overhead, rent, taxes, or other school expenses are included.
- Group revenue comes from student invoices.
- Payout cost comes from teacher payout statements.
- Gross margin and cash margin explain different parts of the business result.
Reports should point back to the source records
When a manager questions a number, the report should lead back to invoices, payments, attendance decisions, lesson history, or payout statements. This keeps management reporting explainable and reduces manual reconciliation.
- Revenue gaps can be checked against invoices and payments.
- Attendance risks can be checked before they affect billing.
- Payout totals can be checked against lesson rows and rates.