Revenue needs manual assembly
If invoices, payments, discounts, and debt are checked separately, monthly revenue reports take longer to trust.
Use scheduling, attendance, invoices, payments, balances, and teacher payout data to understand revenue, debt, group profitability, and operational risks without rebuilding reports in spreadsheets.
No card required. No migration needed to test the reporting flow.
Reporting is only useful when it starts from the same lesson, attendance, billing, and payment data that runs daily operations.
If invoices, payments, discounts, and debt are checked separately, monthly revenue reports take longer to trust.
Missed lessons, absences, and attendance gaps are hard to see when they are not connected to the schedule.
Payout reports become risky when completed lessons, attendance, rates, and corrections are not connected.
Reports should be generated from the same workflow that runs the school.
Use lesson, attendance, billing, payment, balance, and payout records as the source for operational and financial visibility.
The same records used in daily work should answer management questions at the end of the day, week, and month.
Schedule and attendance records show what activity actually happened.
Charges, discounts, payments, debt, and balances show the financial result.
Revenue, debt, payouts, and group performance can be reviewed from the same data.
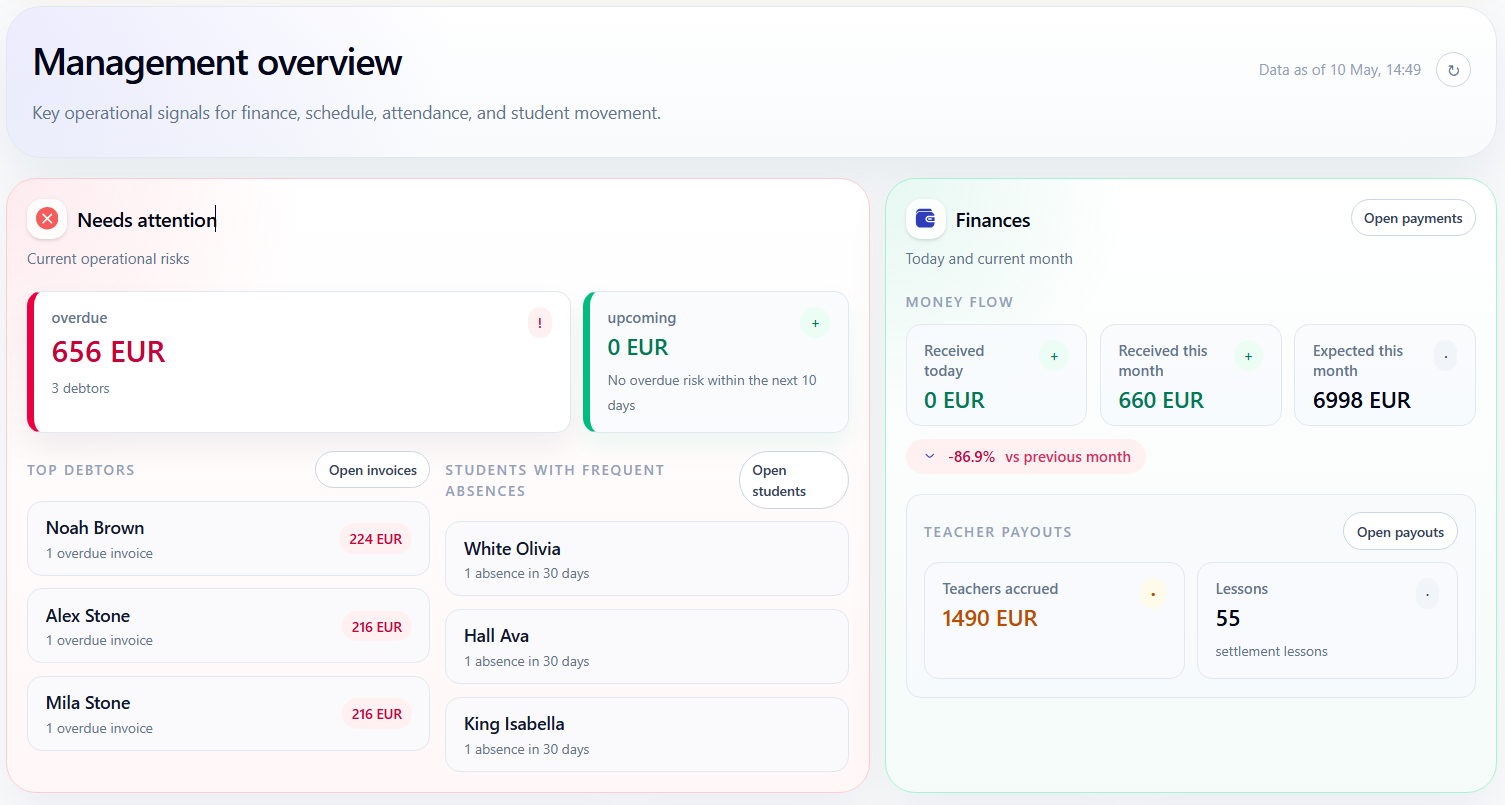
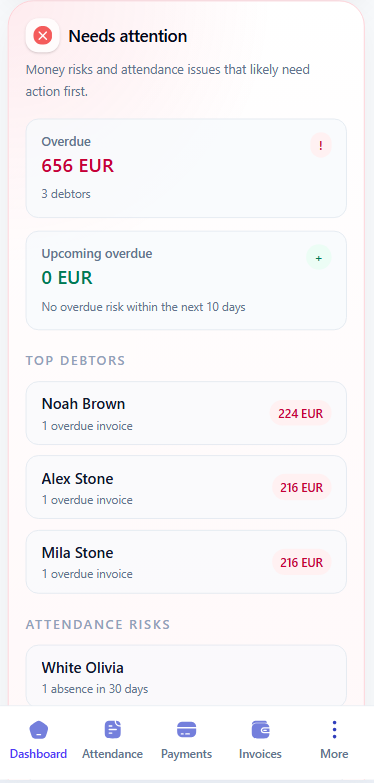
Owners and administrators can see unpaid invoices, top debtors, and missing attendance before those problems turn into month-end surprises.
Typical management question
Check whether the gap comes from fewer completed lessons, unpaid invoices, discounts, attendance issues, or payout changes without comparing separate spreadsheets.
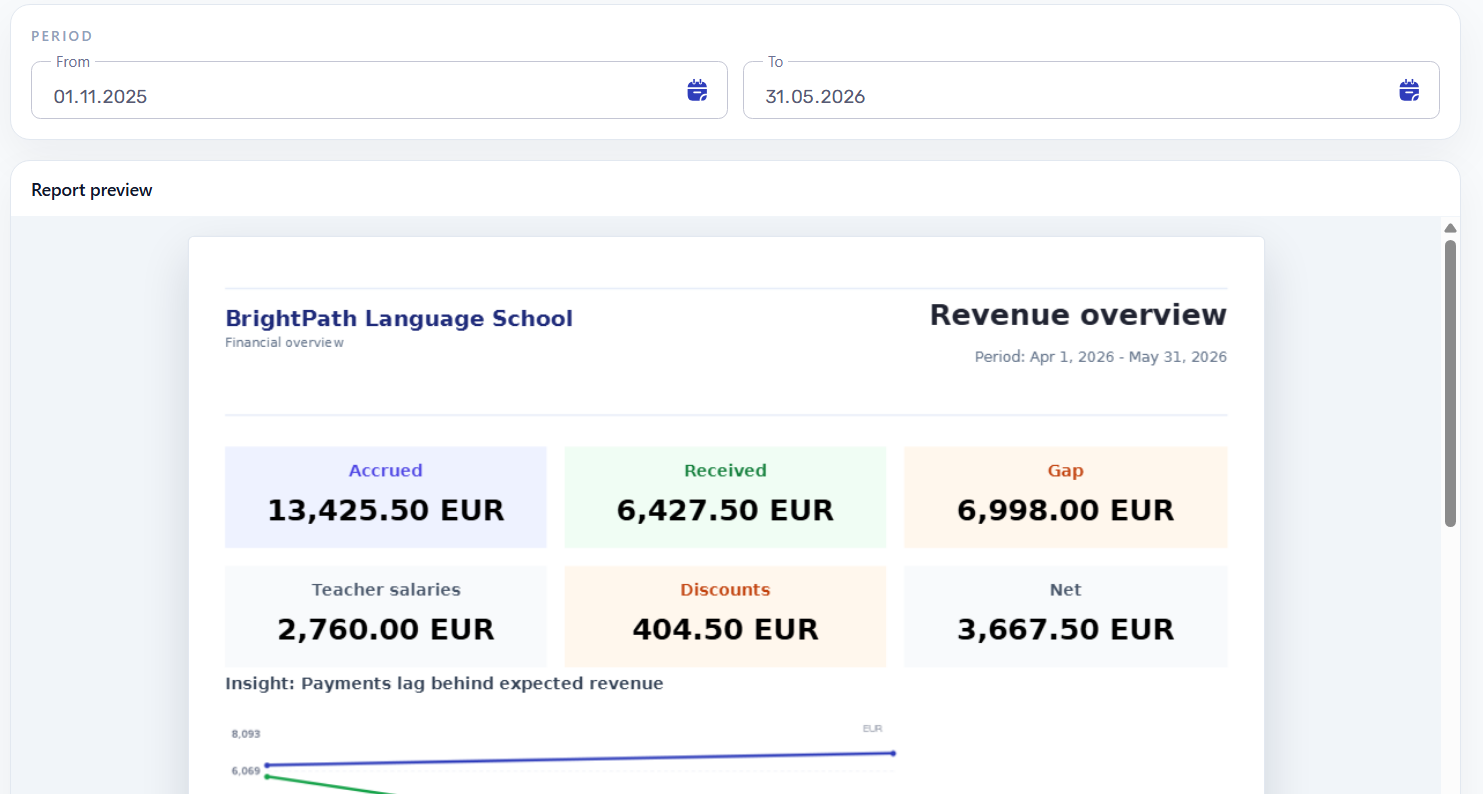
Revenue reports can show accrued amounts, received payments, unpaid gaps, discounts, teacher salaries, and net results in one financial view.
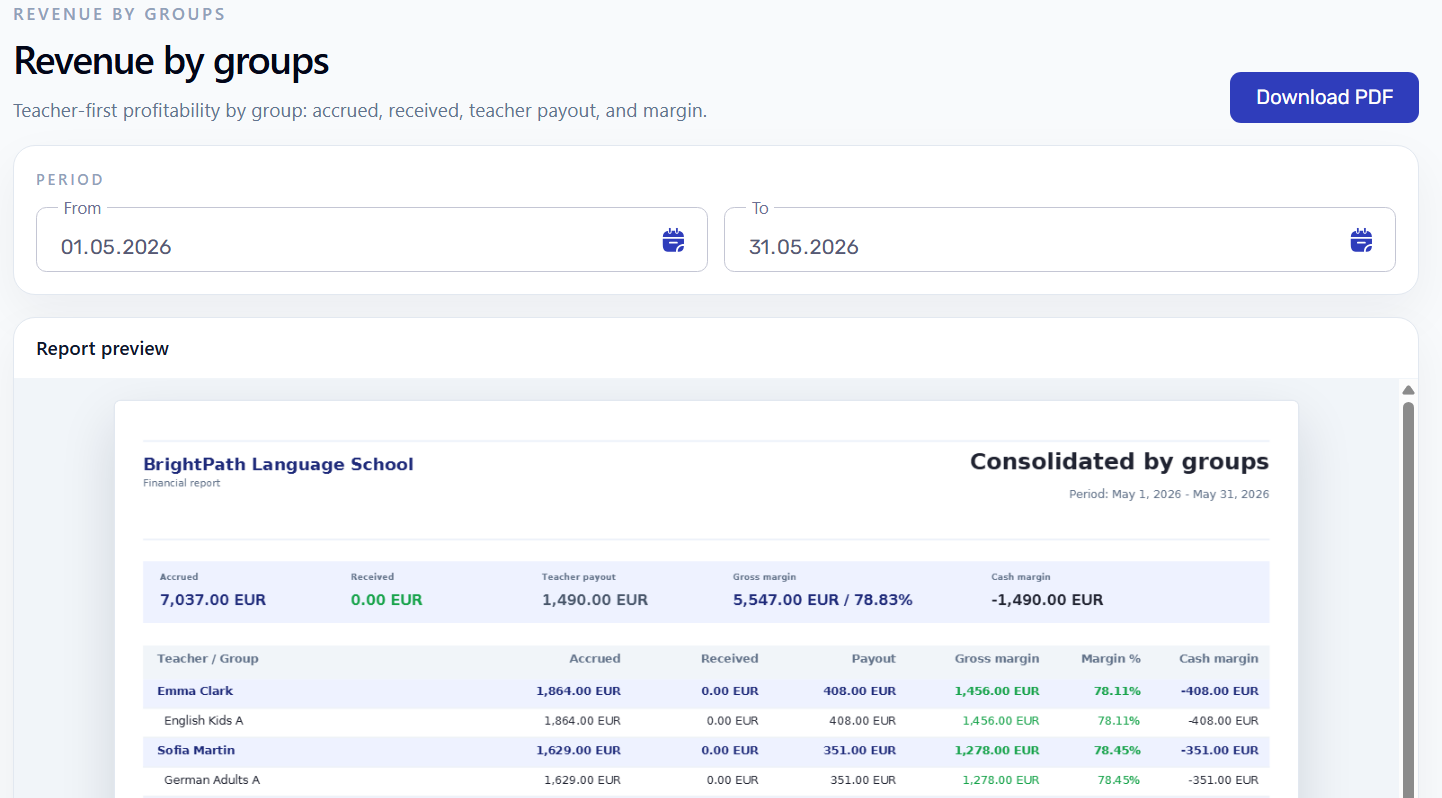
See which groups generate revenue, which ones depend on high teacher payout, and where gross or cash margin needs attention.
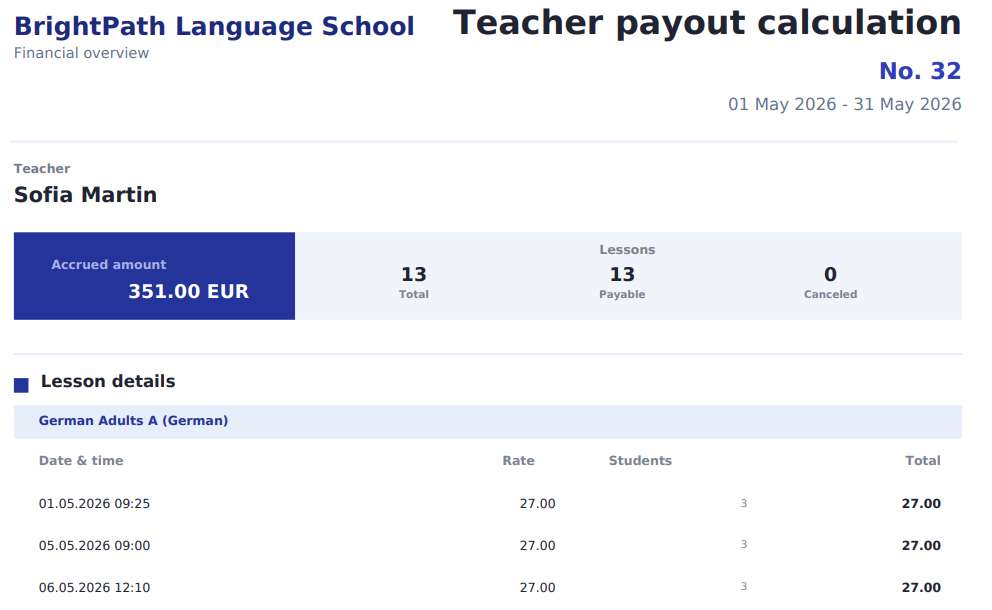
Teacher payout reports can show the lesson history, rates, payable lessons, and calculated payout without rebuilding teacher work manually.
Schedule creates lesson history, attendance confirms what happened, and billing and payments explain the numbers.
Planned and changed lessons become the operational timeline reports can use.
Attendance records explain activity, missed lessons, and payout or billing inputs.
Invoices, discounts, balances, and payments give reports their financial context.
Workflow guides
Use these guides to trace report numbers back to invoices, payments, teacher payouts, and source lesson records.
Start with demo data to see whether schedules, attendance, invoices, payments, balances, and payouts answer the questions your school tracks every month.